Overview: Understanding the Baseline
The first step in creating a plan to manage energy across buildings was to understand the starting point. How much energy are municipal buildings currently using? Which buildings are using more energy than others of a similar type?

The project team gathered detailed data from utility providers and property managers and calculated the Energy Use Intensity of each building to show how energy-efficient each building is.

The project team performed walk-throughs of 59 buildings to collect information on the building envelope and heating, ventilation, air conditioning, and cooling (HVAC) systems to explain WHY a building might be experiencing inefficiencies, and help to identify potential facility energy conservation measures.
The project team interviewed 45 building occupants to find out how they feel their building is operating — are they too hot? too cold? Are they comfortable operating their building equipment? These questions helped the team to understand how operations, decisions, and behaviors influence building efficiency — it matters how systems are used!
Where are municipal buildings today?
The following statistics are based on analysis of the City and County building portfolio.
Where do building emissions come from?
Building emissions mainly come from the energy we use for heating, cooling, and lighting. Buildings create two types of emissions: direct emissions happen when we burn fuels like natural gas inside the building for heating, and indirect emissions occur when we use electricity that was generated by burning fossil fuels at power plants elsewhere. Buildings also produce emissions when their air conditioning systems leak refrigerants.
When building owners make improvements to their buildings, they can not only save energy, but save money on operating costs by reducing the amount of energy they need to purchase. Lincoln and Lancaster County get their energy from Lincoln Electric Systems (LES), Black Hills Energy, and District Energy Corporation. Currently, in 2025, LES electric energy generation makeup is from natural gas, renewables (wind, hydro, solar, and landfill gas), and coal. Black Hills Energy is the supplier of natural gas and District Energy Corporation supplies heating hot water and chilled water to large facilities.
Measuring Baseline Energy Use

Site energy use is the total energy consumed by a building and its site in a year. It is calculated by adding up the total electricity and natural gas used by a building/site based on its electric and gas meters, and subtracting any portion of that energy generated from renewable sources. For this Plan, each building was matched to the electric and gas meter(s) it is served by, then associated with monthly consumption data for the matched meter(s) to determine the energy and gas used in a year.
Site Energy Use Intensity (EUI) measures a site’s annual energy use as a function of its size. This represents a building’s total site energy use from gas and electricity, minus any renewable energy, divided by its gross floor area. When looking at energy use, it’s important to consider building size because larger buildings can be expected to consume more energy than smaller buildings of the same type.
Benchmarking Site EUI helps determine which municipal buildings are exceeding their expected energy use, based on their size and function. Certain building types can be expected to have higher EUIs, so building EUIs should be compared to buildings of a similar type to determine whether an EUI is “too high.” For example, a fire station may have a higher EUI than a library of similar size because it operates and uses energy around the clock, while a library closes after business hours.
This Plan uses the American Society of Heating, Refrigerating and Air-Conditioning Engineers (ASHRAE) 100 Standard to determine the median EUI for each building type.
Buildings with EUIs beyond expected targets can implement energy conservation measures to reduce building-related emissions, getting the City of Lincoln and Lancaster County closer to their goal of carbon neutrality.
This Plan measures the greenhouse gas (GHG) emissions associated with the operation of municipal buildings. GHG emissions are calculated by multiplying the electricity and natural gas used by each building by the emissions associated with consuming a unit of each energy type. This multiplier is called an emissions factor.
While emissions factors are relatively stable for natural gas, this may not be the case for electricity; municipal energy providers may make efforts in the future to generate energy through renewable sources and transition away from fossil fuels. This Plan assumes that multipliers, or emissions factors, remain constant for this Plan’s calculations, so that the City and County can focus on energy efficiency and generating renewable energy within their own locus of regulatory control.
Municipal Building Portfolio Overview
This Plan focuses on the major buildings that account for the majority of building-related City and County greenhouse gas emissions. While the City, County, and PBC operate additional facilities such as bus shelters, parking structures, traffic signals, and ancillary buildings, these account for a very small portion of emissions. Prioritizing energy efficiency investments towards major buildings will help the City and County achieve the greatest emissions reduction.
INCLUDED:
Libraries
Police stations
Fire stations
Community centers and recreation centers
Major transportation and utility operations buildings
Public Building Commission buildings
Other major City and County buildings
NOT INCLUDED:
Minor transportation infrastructure like bus stations, streetlights and traffic signals
Parking garages
Wastewater treatment facilities and major utility infrastructure
Small facilities like pump houses and storage sheds
Building Portfolio by Size
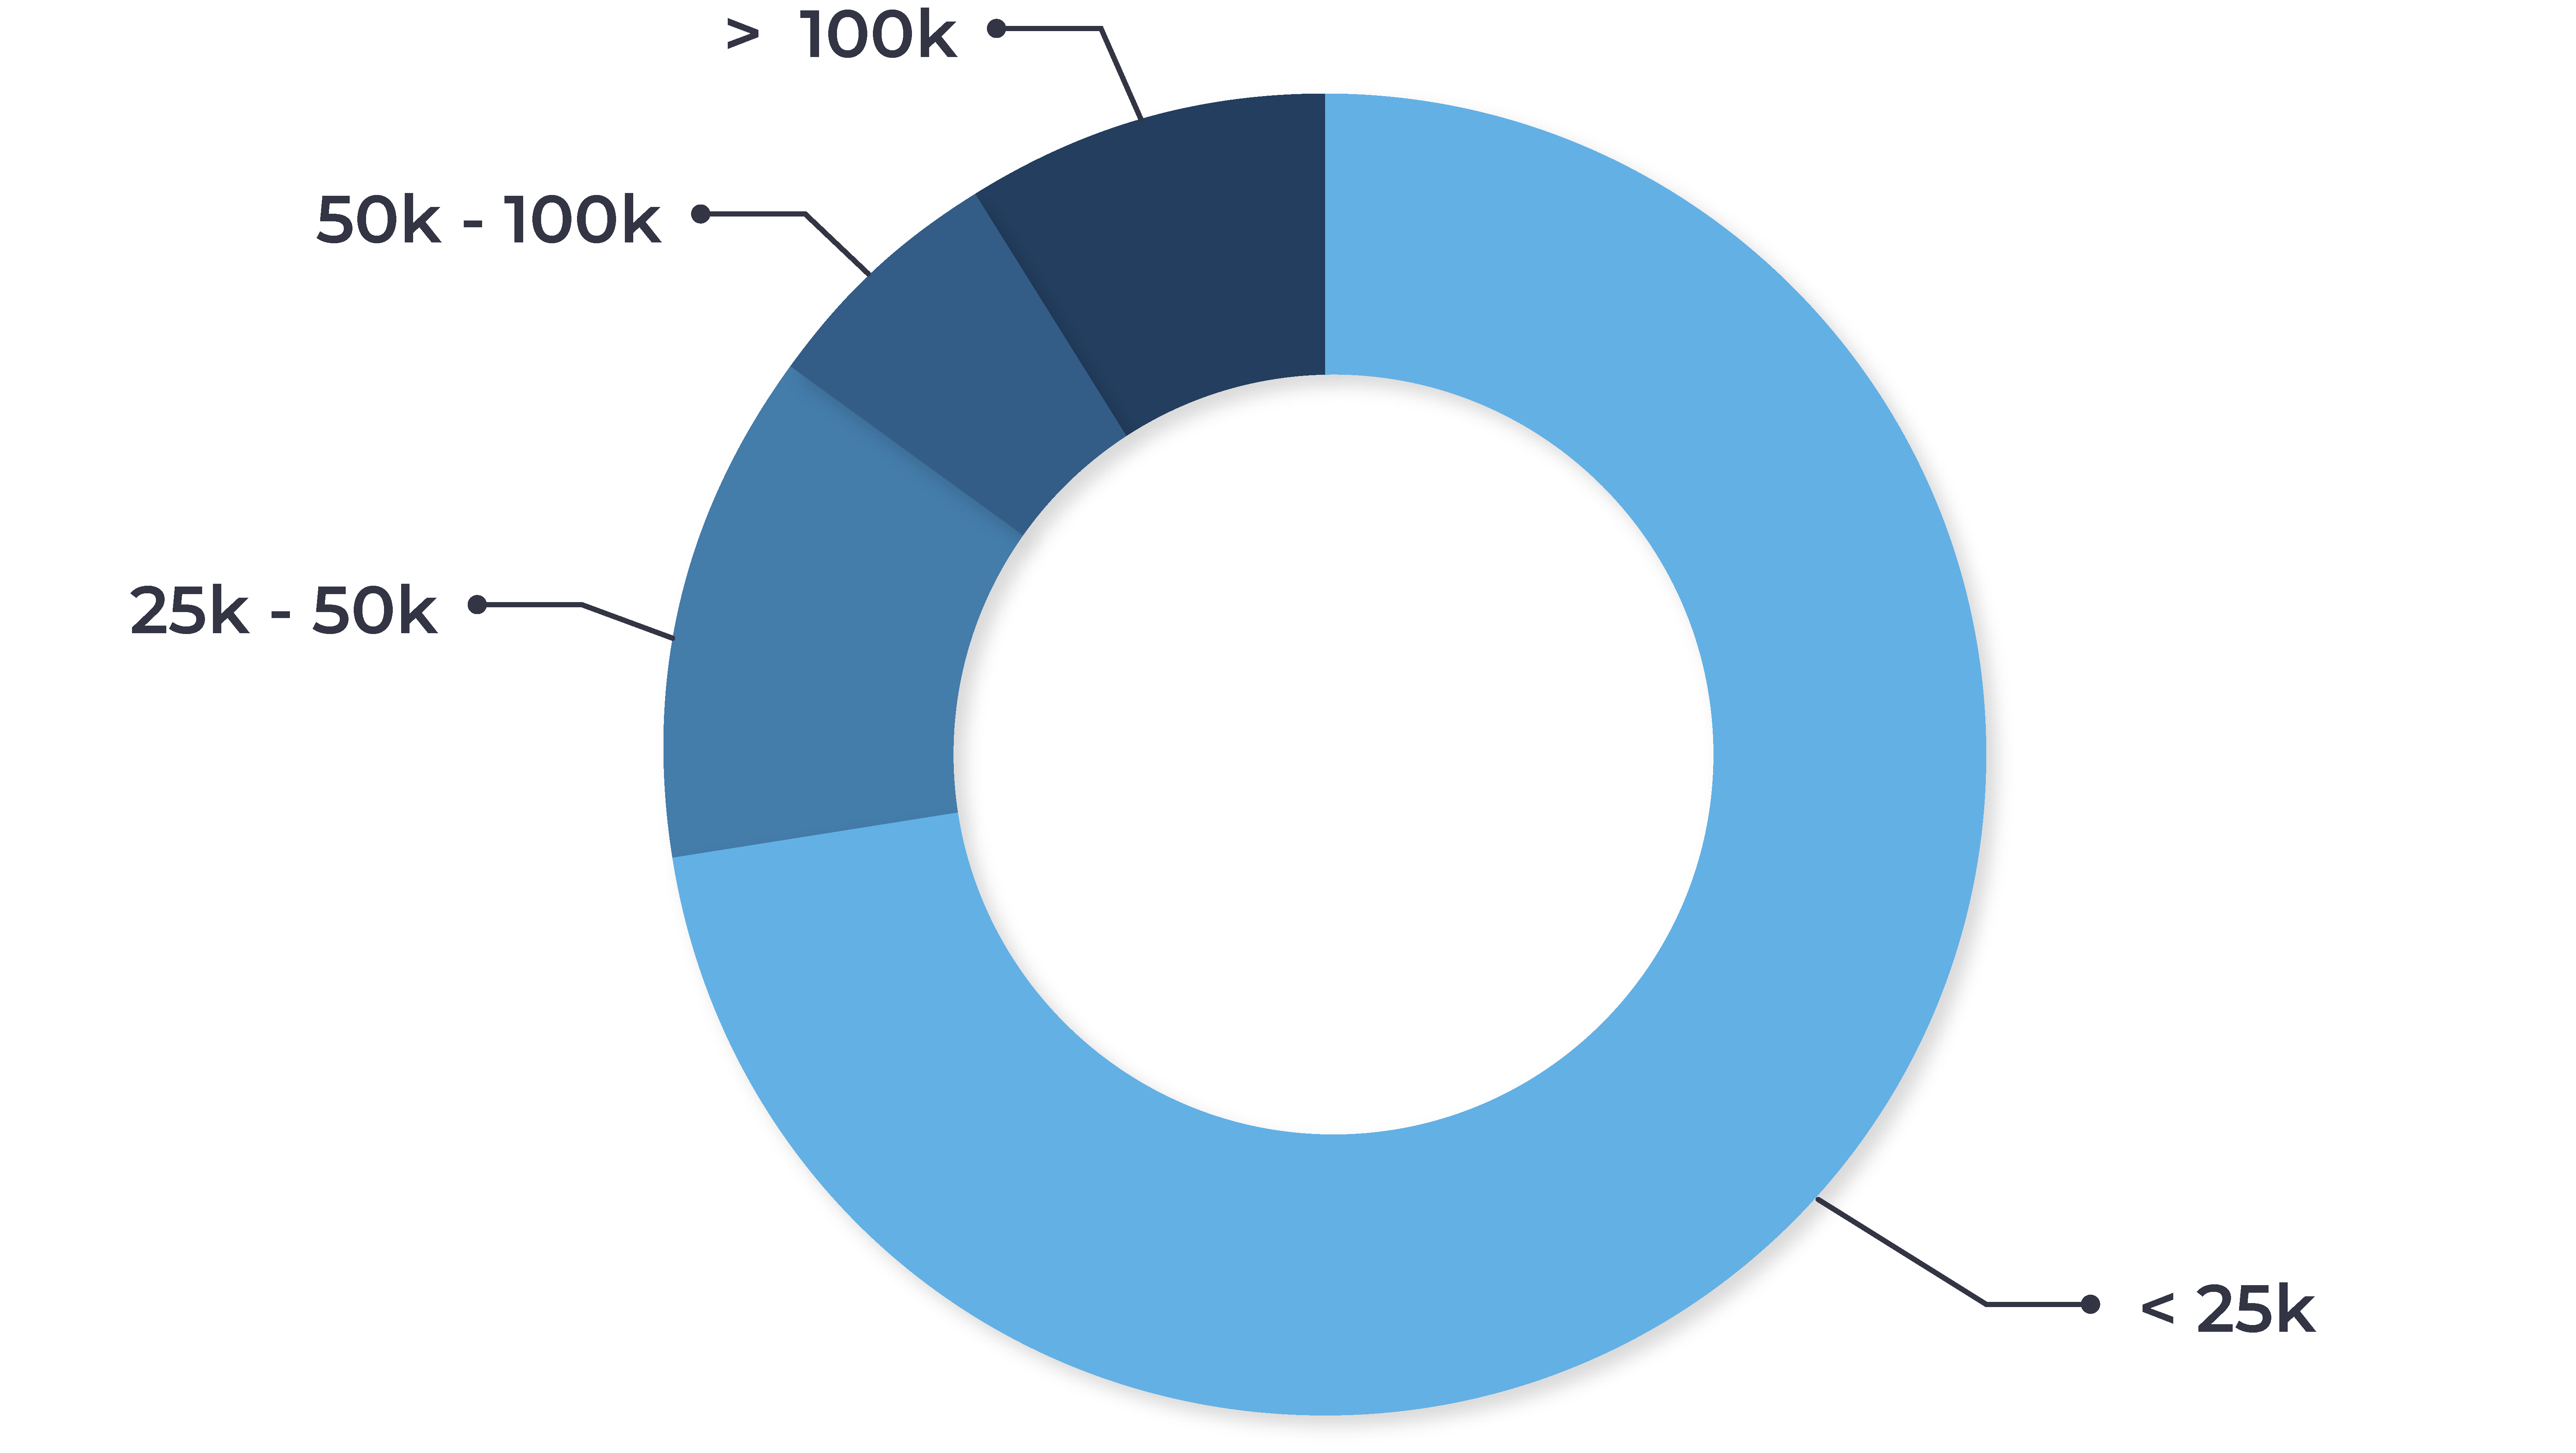
BUILDING SIZE
The portfolio of buildings includes mostly small buildings (less than 25,000 square feet), a few medium buildings (25,000 to 100,000 square feet), and a few larger buildings (more than 100,000 square feet).
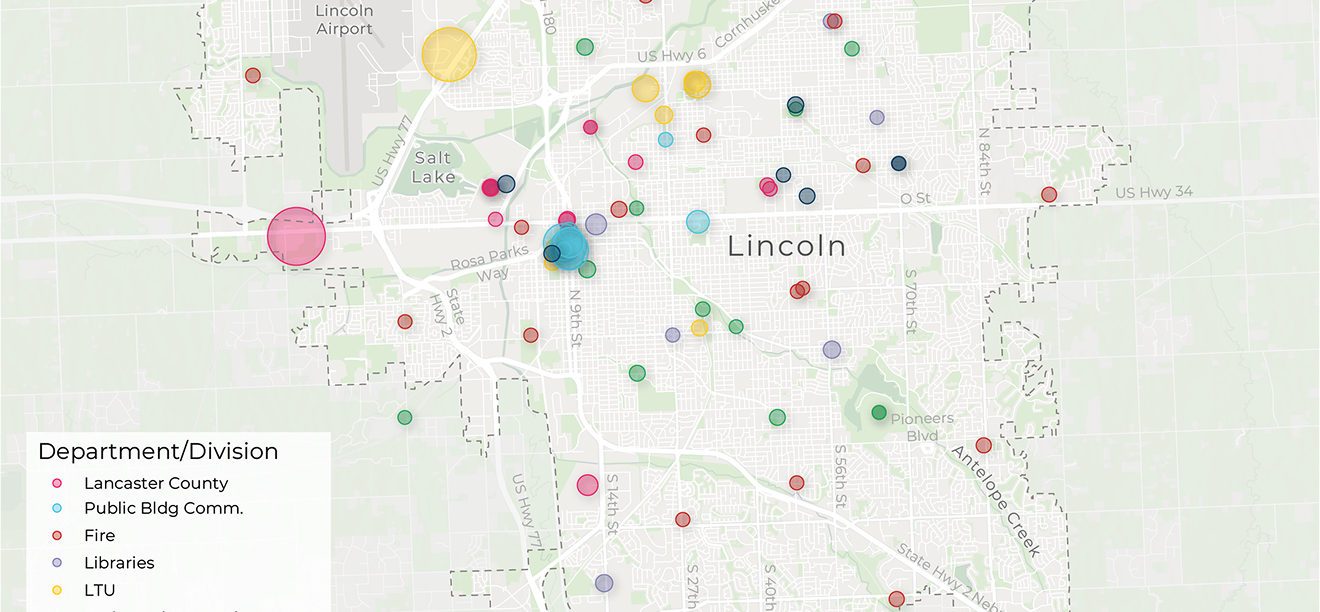
Building Portfolio By Managing Entity
Building Portfolio by Managing Entity
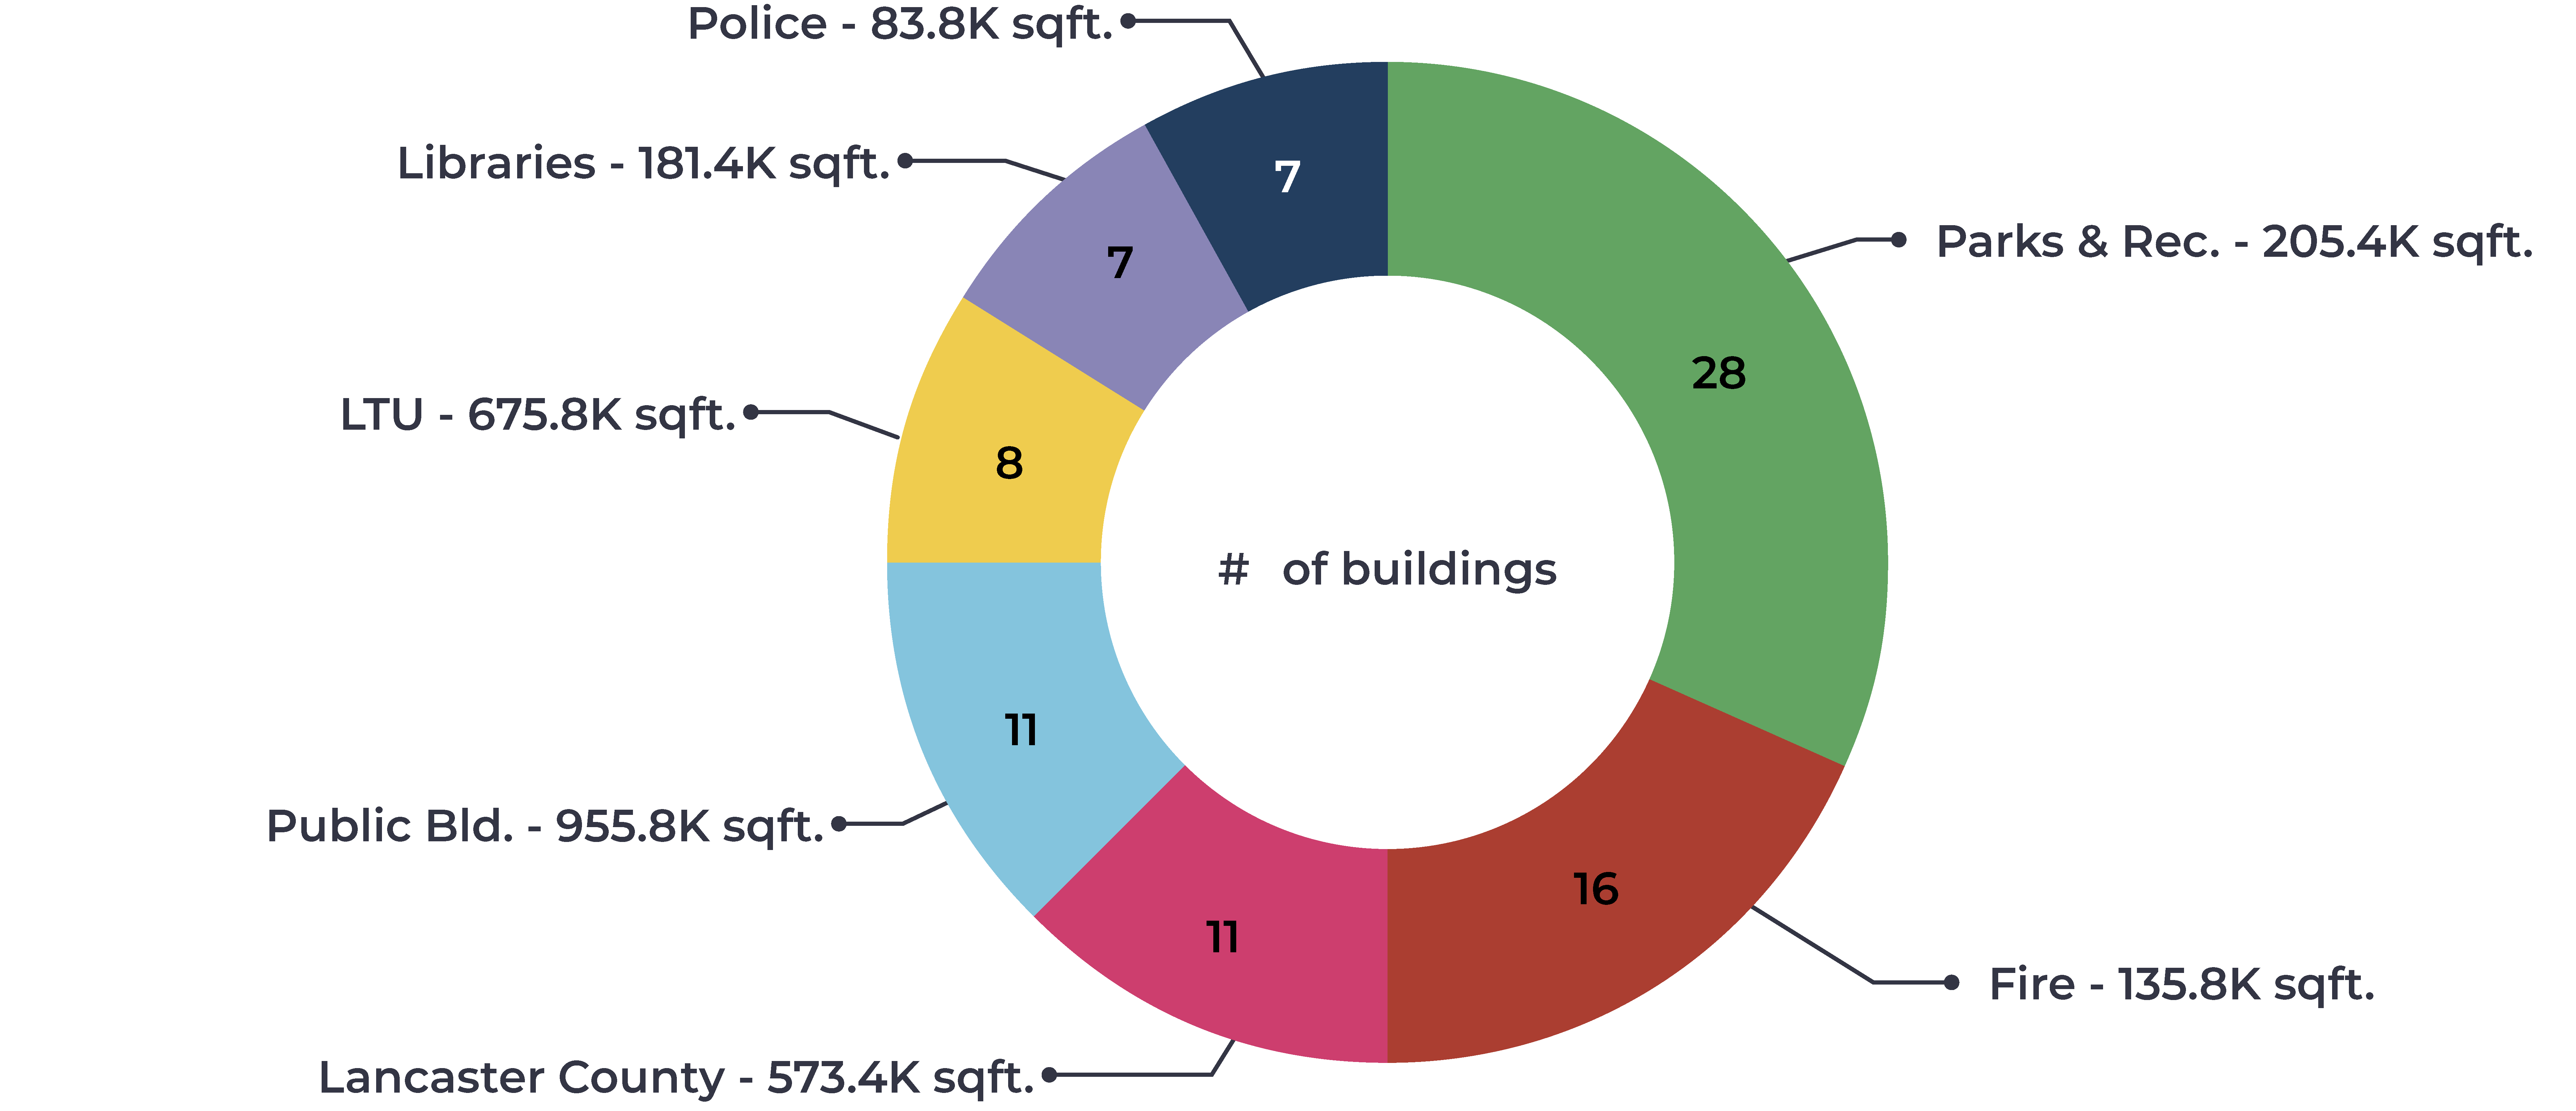
28 buildings
205.4K sq ft building area
877 MtCO2e current building emissions
16 buildings
135.8K sq ft building area
1.3K MtCO2e current building emissions
8 buildings
675.8K sq ft building area
2K MtCO2e current building emissions
7 buildings
181.4K sq ft building area
1.1K MtCO2e current building emissions
7 buildings
83.8K sq ft building area
184 MtCO2e current building emissions
11 buildings
955.8K sq ft building area
5.1K MtCO2e current building emissions
11 buildings
573.4K sq ft building area
5.2K MtCO2e current building emissions

